生物大数据分析
4 . 基于R的数据可视化介绍和应用

4.1 R语言基础
4.2 基于ggplot2的数据可视化
生物大数据分析
4.1 R语言基础

R的历史和特点
|
|
一己之力,引领全球信息时代–-贝尔实验室
R语言基本语法速递
# 安装: https://cloud.r-project.org/

# 对象 object
x <- 1
name <- "小明"
y = 2

# 运算符
+, -, *, /, ^

# 常用函数
sqrt, exp, log, log10, log2
round, floor, ceiling

# 自定义函数
my_add <- function(x,y){x+y}

# 读写 I/O:
# I: read.table, read.csv, read.delim
# O: print, cat, write

# 数据类型: 逻辑型, 字符串, 数字 ...
TRUE, FALS, T, F
"abc", "123", "@!@#$#$%#$^#$%&$%^&"
123, 1e-5, 3.1415926

# 数据结构: 向量, 矩阵, 列表, 数据框 ...
# 向量
v1 <- 1:10
v1 + 100  # 四则运算自动广播
v1 * 2

v2 <- 21:30
v2 - v1   # 等长向量可进行四则运算

# 向量的下标和子集
v1[2]
v1[c(1,3)]
v1[3:5]
v1[c(-1,-10)]
v1[v1>5] # 逻辑下标

# 矩阵: 二维向量

# 列表: 火车

# 数据框 dataframe
d <- data.frame(
    name=c("李明", "张聪", "王建"),
    age=c(30, 35, 28),
    height=c(180, 162, 175),
    stringsAsFactors=FALSE
)
##   name age height
## 1 李明  30    180
## 2 张聪  35    162
## 3 王建  28    175

# 流程控制
## 判断
if(CONDITION1){
    EXPR1
}else if(CONDITION2){
    EXPR2
}else{
    EXPR3
}

ifelse(CONDITION, EXPR-TRUE, EXPR-FALSE) # ? :

## 循环
for(i in 1:5){
    # do sth...
}

while(CONDITION){
    # do sth...
}

repeat{
    # do sth...
    if(CONDITION){break}
}

# 基本统计函数
min, max, median, sd, quantile

# 基本统计检验
t.test
wilcox.test
cor.test
chisq.test

# 聚类分析
kmeans
hclust, dist
生物大数据分析
4.2 基于ggplot2的数据可视化

R语言绘图
科学需要可视化
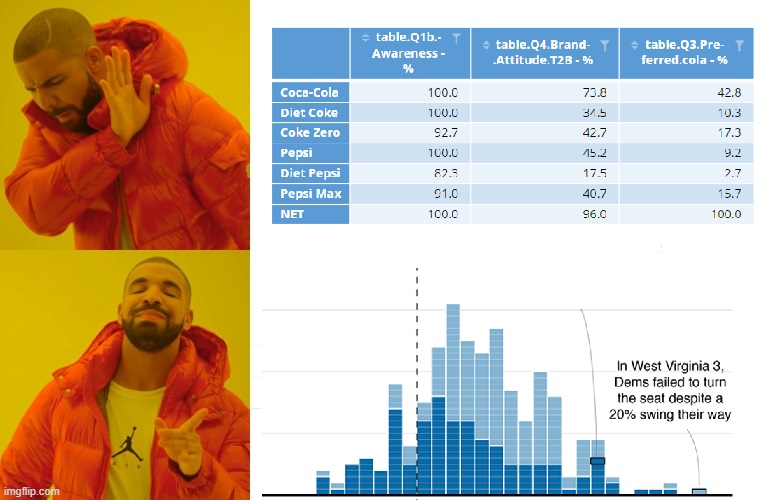
R语言绘图
大批量数据需要基于编程语言绘图

R语言绘图
R的基本绘图语法: 略, 课下自学 基于ggplot2的R语言绘图√
Grammar of Graphics
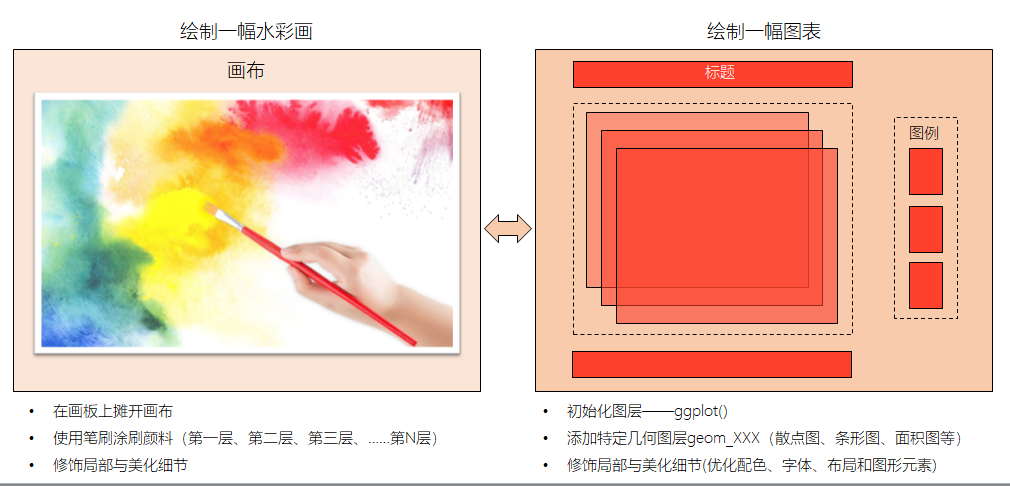

R语言绘图: ggplot2语法
Grammar of Graphics
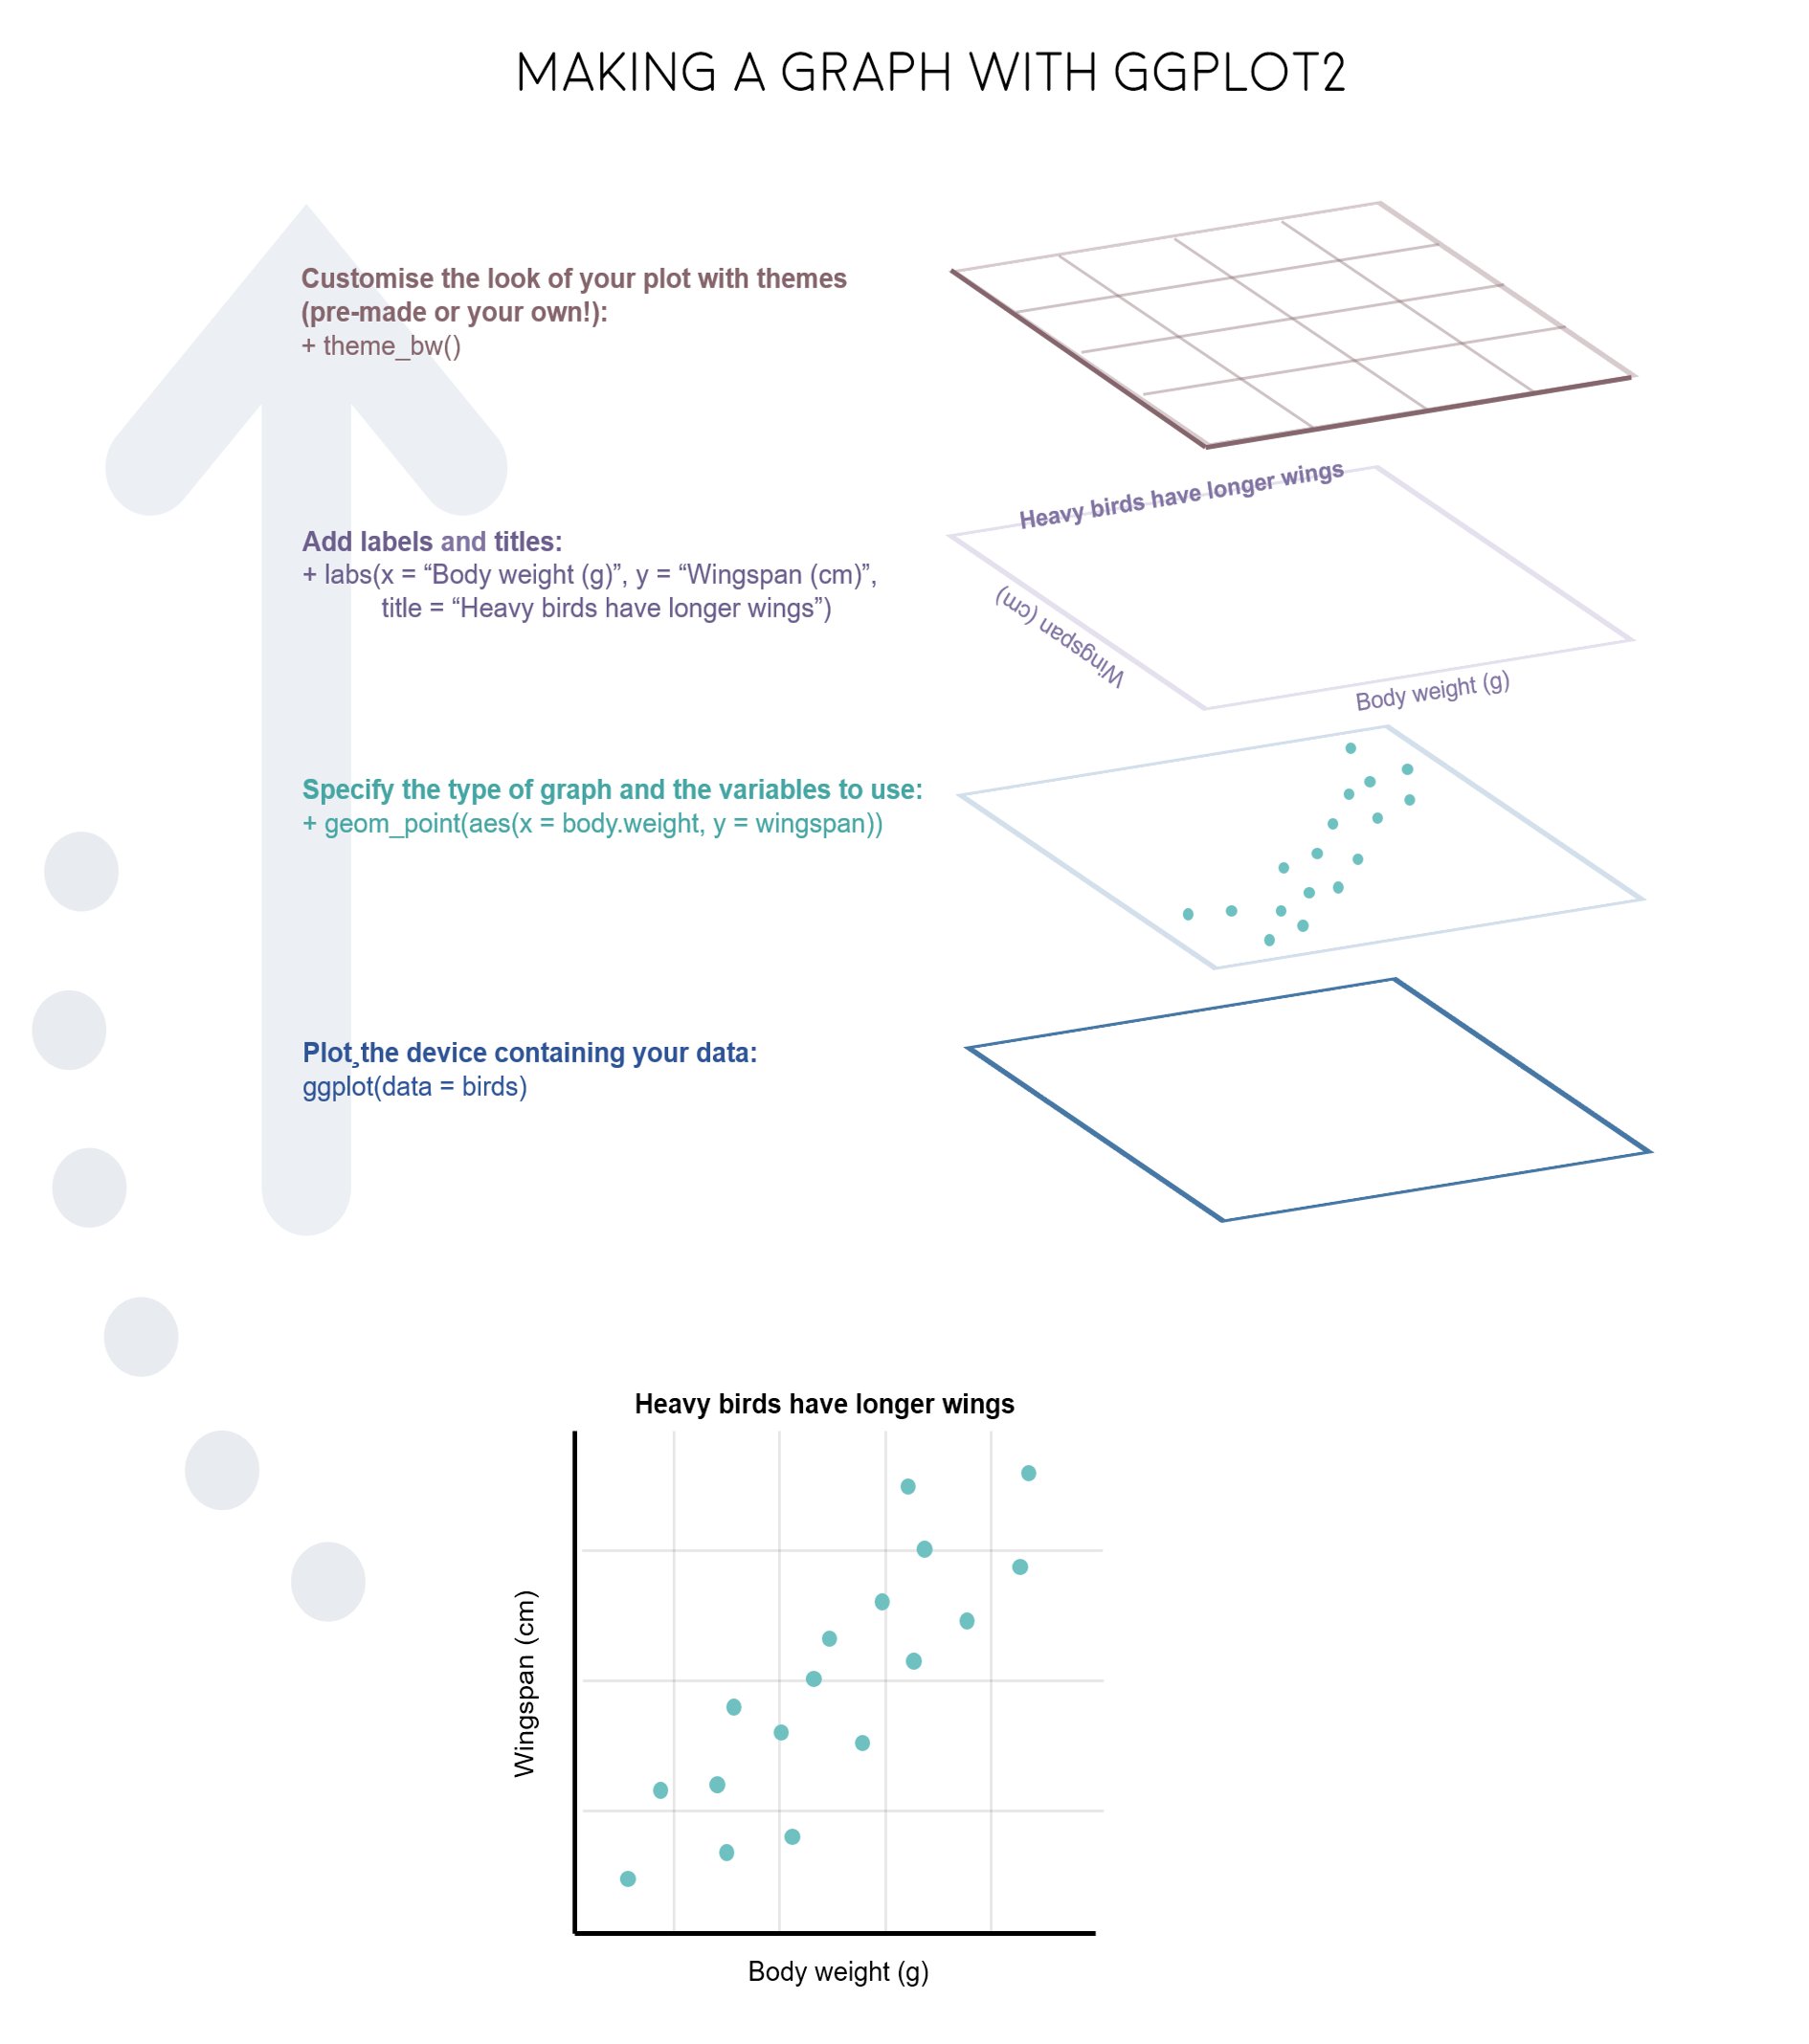
|
R语言绘图: Geoms
|
折线图: geomline, geomabline, geomhline, geomvline
|
|
|
柱形图: geombar, geomcol, stat_count
|
|
|
热图: geombin2d, geomtile, geomhex, geom_raster
|
|
|
箱线图: geom_boxplot
|
|
|
轮廓图: geomcontour, geomcontour_filled
|
|
|
密度图: geomdensity, geomdensity2d, geomdensity2dfilled
|
|
|
散点图: geompoint, geomdotplot, geom_jitter
|
|
|
区间图: geomcrossbar, geomerrorbar, geomlinerange, geompointrange
|
|
|
地图: geom_map
|
|
|
路径图: geompath, geomstep
|
|
|
多边形图: geomrect, geompolygon
|
|
|
条带和范围: geomribbon, geomarea, geom_smooth
|
|
|
线段和曲线: geomsegment, geomcurve
|
|
|
文字: geomtext, geomlabel
|
|
|
小提琴图: geom_violin
|
|
复杂图是简单元素的组合
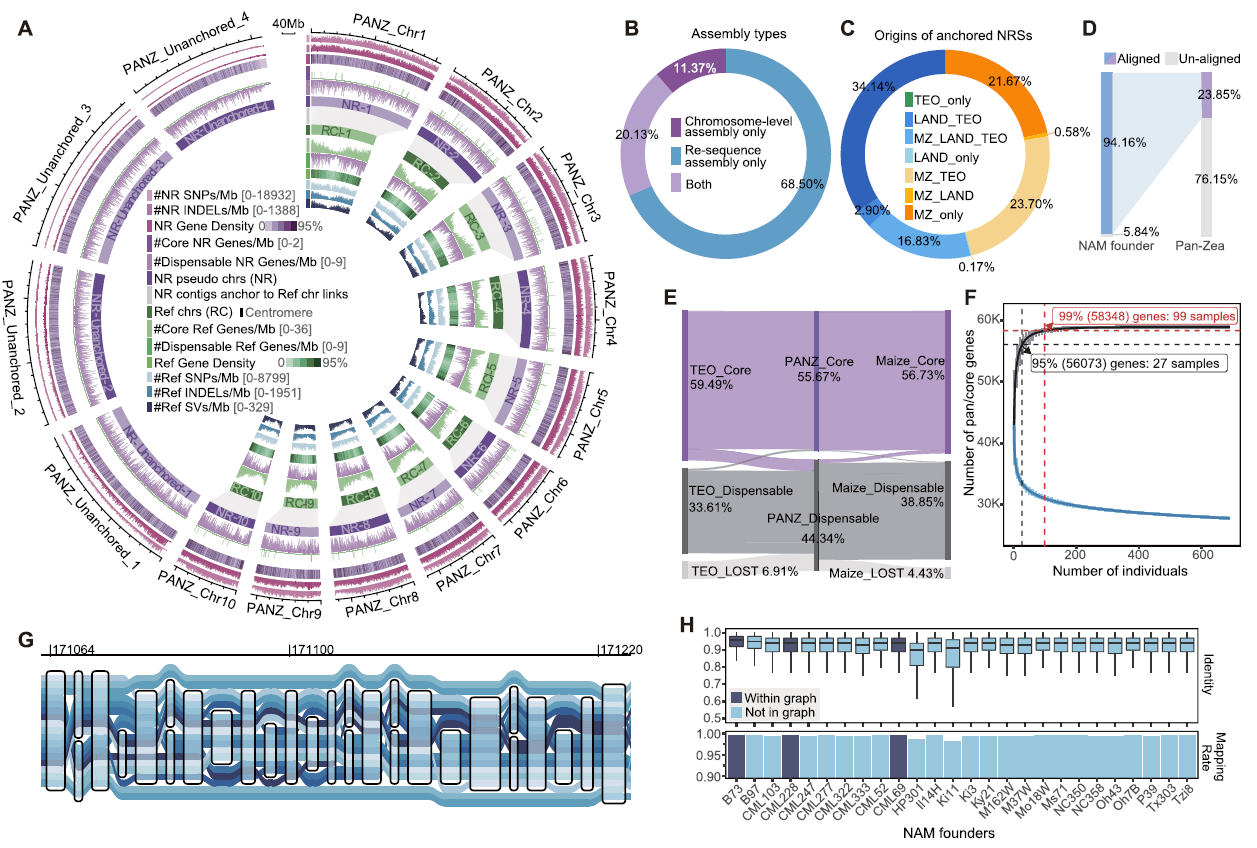 Gui, S., Wei, W., et al. A pan-Zea genome map for enhancing maize improvement. Genome Biol 23, 178 (2022).
|
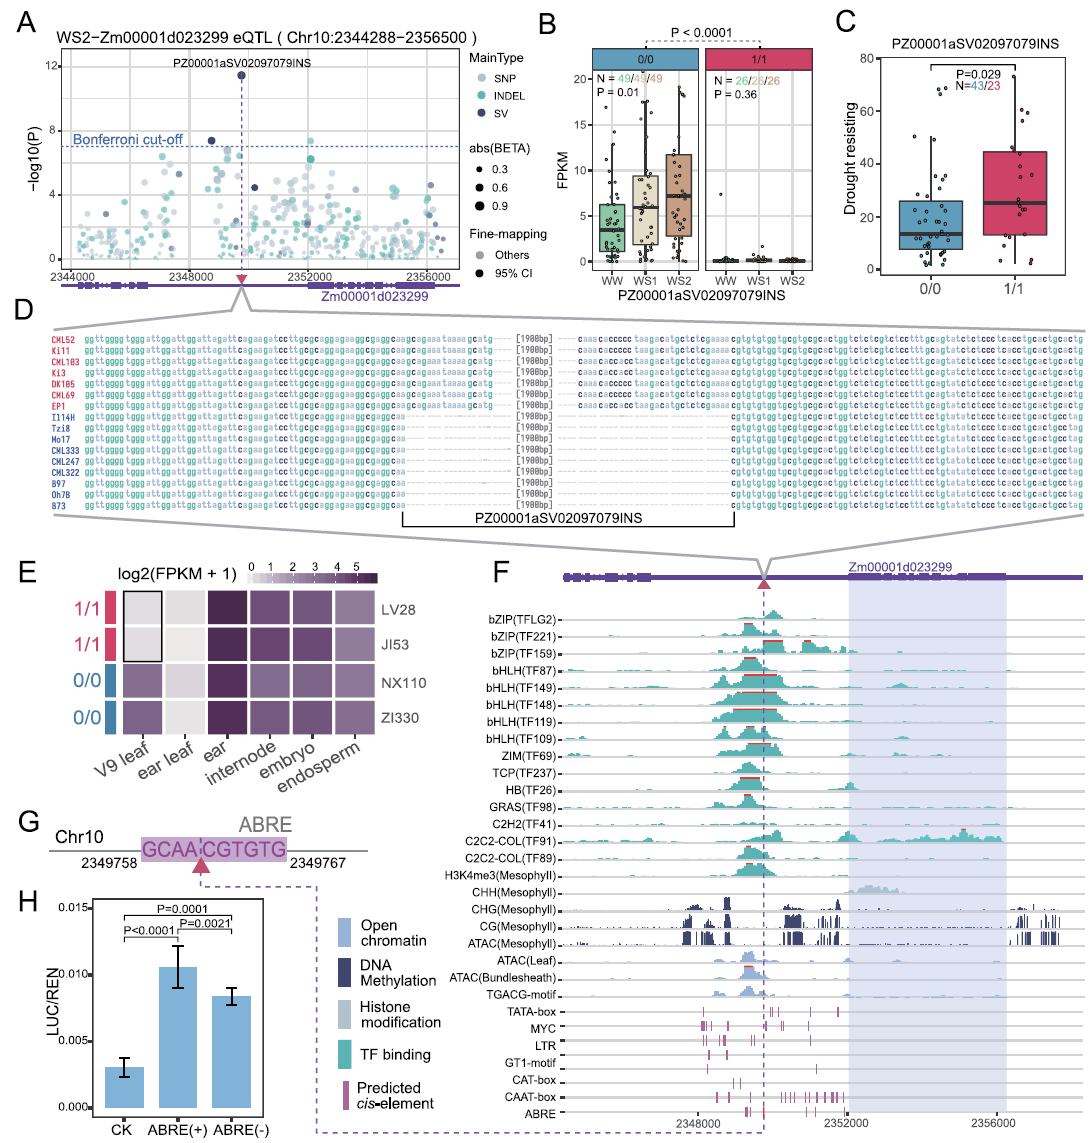
|
作图的一般原则
|
好的数据, 好的展现形式, 好的审美 用尽可能少的元素表示尽可能多的数据
|
ggplot2作图实践
|
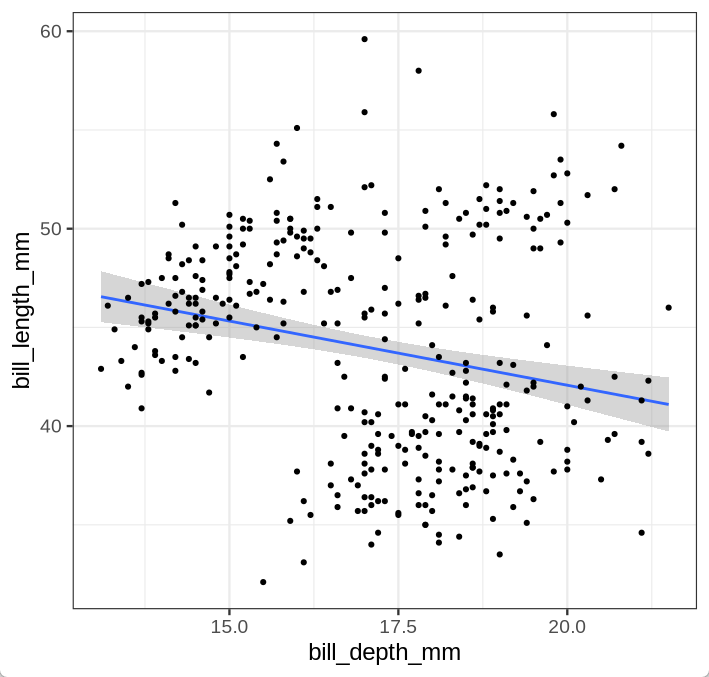
帕尔默企鹅数据集: 嘴巴越长的企鹅,嘴巴也会越厚么?
|
 
|
ggplot2作图实践
帕尔默企鹅数据集: 嘴巴越长的企鹅,嘴巴也会越厚么?
|
学生A: "破案了! 喙厚度和喙长度成反比, 说明嘴短的企鹅, 嘴更厚, 与原假设相反! 毕业! 能毕业了~!" 学生B: "发表! 必须马上发表! 我昨天帮你带饭了, 给我个共一不过份吧?" 老师: "你俩再延一年吧🙂" |
ggplot2作图实践
帕尔默企鹅数据集: 嘴巴越长的企鹅,嘴巴也会越厚么? 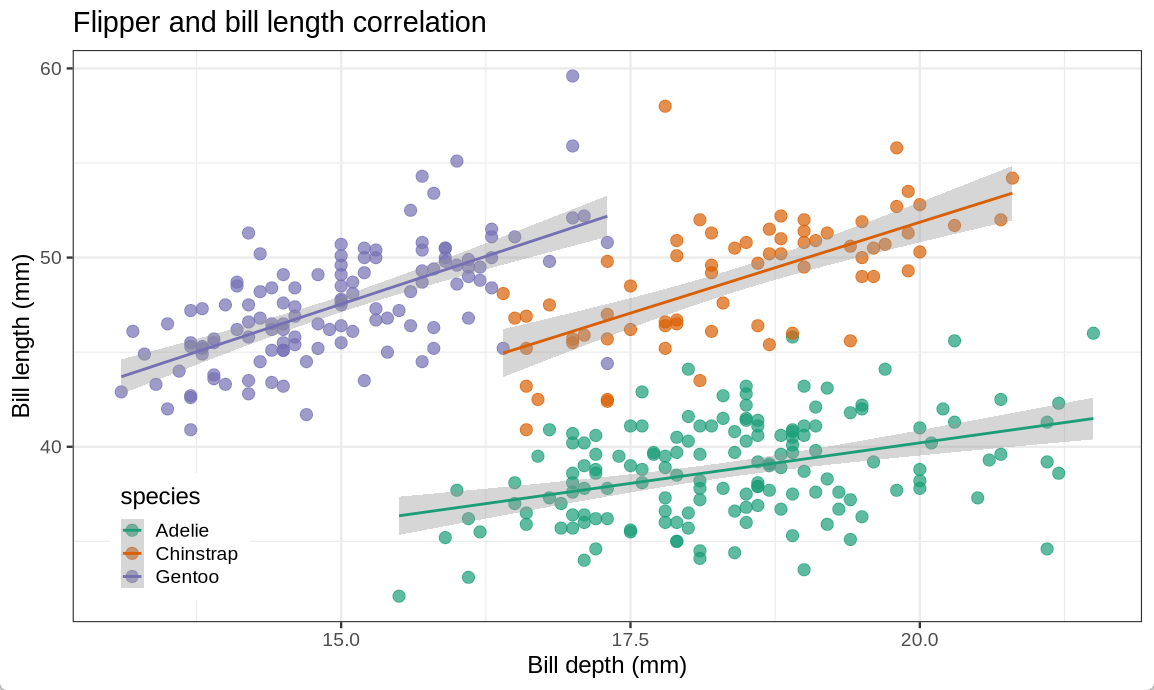
ggplot2作图实践
帕尔默企鹅数据集: 嘴巴越长的企鹅,嘴巴也会越厚么?
# 感觉有点不对劲, 但又说不上来:
ggplot(penguins,aes(x = bill_depth_mm, y = bill_length_mm)) +
    geom_point() +
    geom_smooth(method="lm") +
    theme_bw(base_size=18)

# 这下舒服了:
ggplot(penguins,aes(x = bill_depth_mm, y = bill_length_mm, color = species)) +
    geom_point() +
    geom_smooth(method="lm") +
    theme_bw(base_size=18)

# 加亿点点细节
ggplot(penguins, # 选择x轴,y轴数据映射, 以及颜色映射
            aes(x = bill_depth_mm,
                y = bill_length_mm,
                color = species)) +
    geom_point(size=4,alpha=0.7) + # 点的大小和透明度
    geom_smooth(method="lm") + # 线性回归拟合
    scale_color_brewer(palette="Dark2") + # 配色方案
    labs(x = "Bill depth (mm)",   # x轴标题
         y = "Bill length (mm)",  # y轴标题
         title = "Flipper and bill length correlation" # 总标题
         ) +
    theme_bw(base_size=18) + # 纯白主题, 总字体大小
    theme(legend.position=c(0.1, 0.15)) # 图列位置
拓展学习资料推荐